|
 Country report Greece Country report Greece
PROTECTED CULTIVATION IN GREECE
C. M. OLYMPIOS
Agricultural University of Athens
Laboratory of Vegetable Production
75 lera Odos, Votanikos
Athens 118 55
Greece
(Presented during the First Coordinating Meeting of the FAO regional working group on greenhouse crops in the SEE Countries. Budapest, 20-22 October 2004)
Introduction
Out of the 3.92 million ha of the total cultivated agricultural land in Greece, it is estimated that only about 3.4% is occupied by vegetable crops while the contribution of vegetable products to the gross value of horticultural produce is 18.3%. The main objectives for vegetable production in Greece is to satisfy local demands, as well as to export those vegetables, which are in demand at remunerative prices. Generally speaking vegetable crops produced in the open fields usually cover the local demand with the exception of asparagus, various types of sweet pepper and processing cucumber, which are exported. On the contrary those vegetables produced out-of-season (in winter and early spring months) such as watermelons, cucumbers, peppers, eggplants, are in high demand on local and foreign markets and prices are high, therefore, of great economic importance to Greece. The total production of vegetables the recent years increased in comparison to the previous decade, a result mainly of an increase in yield rather than to the area under production. The Greek Ministry of Agriculture is promoting selected new hybrids for the production of vegetables in greenhouses and low tunnels.
At the same time new greenhouse structures with advance equipment and control systems for heating (with solar and geothermal energy), thermal screens, fog systems, cooling systems, exhaust fans, ventilation, irrigation, desalinization plans for improving quality of irrigation water, pests and diseases control, biological control etc., are promoted. Nursery units for commercial production of vegetable seedlings and asparagus crowns are also promoted. For asparagus, methods and techniques for induction of earliness in production is encouraged. Finally, the Ministry of Agriculture is subsidizing the erection of walk-in tunnel type greenhouses for the production of out of season vegetables in areas and islands to the South part of the Country.
BACKGROUND INFORMATION
Greece, with an area of 13.2 million ha and a population of about 10 million, lies between 3 5° to 43° North and 19° to 27° East.
Nearly thirty per cent (29.7%) of the total area of the country, i.e. 3.92 million ha, is cultivated agricultural land. Of the rest, 16.5% (2.21 million ha) is uncultivated private land, 22.6% (2.98 million ha) is forest, 23.0% (3.0 million ha) is state and communal grazing land and 8.2% (1.08 million ha) comprises urban and rural settlements, roads, riverbeds, lakes etc. (Table 1).
AGRICULTURE IN GREECE
Out of the total of 3.92 million ha of cultivated agricultural land, it is estimated that 55-56% is plain areas, 25-26% semi-hilly areas and 18-19% hilly areas.
The distribution of cultivated crops in the agricultural land is as shown in Table 2. Cereals and industrial annual crops occupied 66.7% of the total area, tree crops 25.2%, vines 4.7% and vegetables 3.4%.
The percentage of cultivated land under irrigation is 34% (i.e. 1.2 million ha). The area of vegetable crops under irrigation was 92.5%, cereals and industrial crops 34.8%, tree crops 27.4% and vines 16.6% (Table 2).
CONTRIBUTION OF AGRICULTURE TO THE ECONOMY OF THE COUNTRY
- Although agricultural land covers only about 30% of the total area of the country, agricultural produce is sufficient to satisfy nearly all the needs of the country (with the exception of bovine meat and some dairy products).
- Today (2002) agriculture provides employment for about 15-16% of the working population.
- During 2002, the contribution of the agricultural sector to the Gross National Product (GNP) was 13.5% .
- Agricultural exports during 2003 contributed 25% of the total national exports, while agricultural imports were 12.4% of the total imports. It seems that there is a deficit in the trade balance as the value of exports accounts for only 60% of that of imports. This is mainly due to the imports of large quantities of beef, dairy products, fruits and vegetables.
- The contribution of vegetables to the gross value of agricultural and horticultural produce was 18.3%, although the area cultivated was only 3.4%. Vegetables occupied 11.3% of the total area of horticultural crops and produced 44.3% of total production.
CLIMATIC CONDITIONS
Climatic conditions vary among the different geographical position of the country (Greece lies between 35o to 43o North). In the South, i.e. Crete, the mean, mean max and mean min monthly air temperatures are much higher compared to the North areas. Examples of the temperature conditions in four areas selected to represent geographical positions from South to North (this can be seen from the Latitude) and where greenhouses are constructed in sizeable areas are presented in Table 3.
Looking also at the figure presented in Table 4, it is obvious that the geographical distribution of greenhouses follows more or less the climatic variation of the regions, More greenhouses are situated in the most favourable regions as far as climate is concerned (mild winters, frost-free areas), i.e. of primary importance is the possibility of producing crops (vegetables and ornamentals without or with minimum heating requirements.
Table 4, shows the greenhouse area in the various regions for 1988 and 2002. Crete appears to have nearly half of the area (44.1% in 2002) and Peloponnese and West Sterea Hellas follow with 22.2% in 2002. Other important regions are the West and Central Macedonia, places around Thessaloniki (16.4%) and in Attica & Islands, mainly in the Marathon area, 7,9% in 2002, i.e. highly populated areas.
CULTIVATION OF VEGETABLES
The main objective of vegetable production in Greece is to satisfy local demands, as well as to export those vegetables, which are in demand at remunerative prices. Generally speaking, vegetable crops produced in the open fields cover local demand and agricultural policy is to keep the area and quantities produced constant, with the exception of asparagus and various types of sweet-pepper, which are also exported. On the contrary, the production of out-of-season vegetables (during the winter and early spring) is encouraged because of their demand on local and foreign markets (tomatoes, cucumbers, peppers, eggplants, watermelons, etc.) at high prices.
The area and production of vegetable crops grown in Greece during the period of 2002 are shown in Table 5.
Total production of vegetables in recent years has increased in comparison with previous decades, a result mainly of an increase in yield rather than in the area under production. The most important vegetable crops for export are watermelons, asparagus, cucumbers, potatoes and to a lesser extent, special types of peppers, melons and tomatoes.
The annual production of vegetables today is about 4.6 million tons out of which. 60% are consumed fresh through local markets, 25% are used for processing, 13% are exported and 2% constitute losses or self-consumption by the growers. Out of this 4.6 million tons an amount of about 10 million ton i.e. 22% is produced in greenhouses and low tunnels.
PROTECTED CULTIVATION OF VEGETABLES
Out-of-season production of vegetables in greenhouses and low tunnels is of great economic importance to Greece as the geographical position of the country offers basic climatic advantages in comparison to northern European countries (Tables 4 & 6). The principal greenhouse crops are tomatoes, mainly for the local market, cucumber and sweet peppers for both the local market and exports (Fig. 1 & 2). The main crops produced in low tunnels are watermelons, a large amount of which are exported, plus sweet melons mainly for local consumption.
In Table 7 the vegetable hybrids grown at present (2004) in the greenhouses and low tunnels are presented.
SOILLESS CULTURE - HYDROPONICS
It is estimated that an area of about 150 ha are used for soilless culture of vegetables, the majority of which (100 ha) with tomatoes, 45 ha with cucumber and 5 ha with lettuce. Also about 15 ha are used for the production of ornamentals, mainly roses, gerbera, etc. The main substrate is rockwool 75%, 10% perlite, 10% NFT and 5% coco-soil, pumice and other materials.
TYPES OF GREENHOUSES USED AT PRESENT FOR THE PRODUCTION OF VEGETABLES
In Table 8 the area of the various types of greenhouses in two periods (1998 and 2002) are presented. It is clear that glasshouses are not used in big areas for the production of vegetables in Greece. It is also clear that the standardized metallic structures as well as the standardized wooden structures with plastic cover are increasing. The old type structures with the exception of the double span with wooden roof and plastic cover are decreasing.
The total area of greenhouses is increasing and between 1998 and 2002 there was an increase 15,7% which shows an average increase of 149 ha/year. From Table 4 it can be seen that the annual increase in greenhouse area is taking place in the South of the Country i.e. Crete, Peloponnese & West Sterea Hellas and Attica and Islands.
Cost of Greenhouse Structures
The mean cost today (2004) of the various types of greenhouse structures including the covering material (plastic film or glass, as well as the labour expenses for erection), varies from 50 Euros/m2 for the glasshouses and 35 Euros/m2 for the multispan metallic structures with plastic cover. As expected glasshouses are much more expensive due to higher cost of the heavy structure and the glass.
Heating of greenhouses
In 1982 only 15% of the greenhouses, both covered with glass and plastic had installations of heating systems.
In 1999 this percentage went up to 45%. Out of these only 18% had control systems to regulate the temperature inside the structures, the rest (27%) with simple heating systems to avoid frost damage or to reduce relative humidity and of course the remaining 55% with out any heating facilities (Fig. 3).
It is estimated that 90% of the heated greenhouses are using mazout or heavy fuel oil, 7% Biomass energy (i.e. burning olive seeds), 2% solar energy, 1% geothermal energy and only 0.03% are using heat pumps as source of energy (Fig. 4).
Greenhouses with heating facilities using mazout or heavy fuel oil as source of energy employ different methods of heating, i.e. 86% are using air heating, 11% central heating with metallic pipes and hot water of 85oC and 3% central heating with plastic pipes and hot water of 45oC (Fig. 5).
EXPORT OF VEGETABLES
The quantities of the main vegetables exported during the period 1998-2002 are shown in Table 9. It is interesting to note that the majority of vegetables exported in quantities of economic importance are those produced out-of-season in greenhouses and low tunnels (watermelons, cucumbers and peppers). It is obvious that there is an increase of the quantities exported the last years for watermelons, cucumbers and green peppers.
The main countries to which vegetable crops are exported from Greece are Germany, Italy, the Netherlands, France, Britain, Bulgaria, Rumania and Poland.
To increase the exports of vegetables, the following measures need to be undertaken:
- Organize more effectively all steps of the export trade.
- Improve packing houses, the quality of packing, use more precise standards, regulations etc.
- Improve transportation
- Produce biological products.
- Use stores with modified atmospheres.
- Introduce electronic commerce.
- Attention must be paid to the search for markets in Eastern European Countries as there
are prospects for increasing exports to these markets.
TRENDS-RESEARCH AND DEVELOPMENT
Out-of-Season Vegetable Crops
Development Programs
- The Greek Ministry of Agriculture is promoting selected new hybrids suitable for the various areas for the production of vegetables in greenhouses and low tunnels.
- The Ministry is subsidizing the erection of walk-in type greenhouse covered with plastic film for the production of out-of-season vegetables in areas and islands to the South part of the Country.
- Also, new greenhouse structures with advance equipment and control systems for heating (with solar and geothermal energy), thermal screens, fog systems, cooling systems, ventilation, exhaust fans, irrigation, desalinization plants for improving quality of irrigation water, pests and diseases control, biological control etc. are promoted and subsidized.
- Nursery units for commercial production of vegetable seedlings and for grafting onto resistant rootstocks are also promoted.
- The new projects are subsidized by 40% from E.U. funds and additional 10% is given to the new growers if their application is approved by the Ministry of Agriculture.
Ongoing Research Work
Research work is concentrated on the production of disease-free propagation material, and the production and selection of new local hybrids and varieties of vegetables for products of better quality and resistance to the mayor diseases, suitable for greenhouse cultivation, as well as improvement of cultivation techniques including the hydroponic systems. Under research evaluation are subjects related to nutrition, to the biological control of pests and diseases, to salinity problems and selection of resistant rootstocks. Research work has also been established on standardization, packing and transportation of fresh vegetables. In parallel, research work is being carried out on the application of solar and geothermal energy to greenhouse heating.
TABLE 1. LAND DISTRIBUTION IN GREECE
Land use
|
Area (million ha)
|
%
|
|
Cultivated agricultural land |
3.92* |
29.7 |
|
Uncultivated private land (grazing land) |
2.21 |
16.5 |
|
State and communal grazing land |
3.00 |
23.0 |
|
Forest |
2.98 |
22.6 |
|
Urban and rural settlements, roads, riverbeds, lakes etc. |
1.08 |
8.2 |
|
Total area |
13.19 |
100.0 |
Greece lies between 35o to 43o North and 19o to 27o East.
* out of this area it is estimated that 55-56% is plain area, 25-26% semi-hilly areas and 18-19% hilly areas.
TABLE 2. DISTRIBUTION OF CULTIVATED LAND BETWEEN THE VARIOUS CROPS IN GREECE (THOUSAND HA)
|
Cultivated crops |
Cropping area |
Irrigated area |
|
ha x 1000 |
% |
ha x 1000 |
% |
|
Agricultural crops |
2353.7 |
66.7 |
818.0 |
68.3 |
|
Vegetables (open, greenhouses) |
118.3 |
3.4 |
109.4 |
9.1 |
|
Vines (table and rasins) |
164.9 |
4.7 |
27.4 |
2.3 |
|
Tree crops |
889.1 |
25.2 |
243.6 |
20.3 |
|
Total |
3526.0 |
100.0 |
1198.4 |
100.0 |
|
Rotation (1-5 years) |
394.0 |
|
|
|
|
Total cultivated land |
3920.0 |
|
|
|
|
Irrigated area in 1989 |
34% |
|
|
|
The percentage of cultivated land under irrigation was 34% (i.e. 1.2 million ha)
The area of vegetable crops under irrigation was 92.5%, cereals and industrial crops 34.8%, tree crops 27.4% and vines 16.6%.
TABLE 3. MEAN TEMPERATURES OF FIVE AREAS IN GREECE
|
AREA |
IERAPETRA |
PYRGOS |
AGRINION |
MIKRA (THES/NIKI) |
Lat:
35ο 00΄ |
Long:
25ο 45΄ |
Alt:
16 m |
Lat:
37ο 41΄ |
Long:
21ο 26΄ |
Alt:
12 m |
Lat:
38ο 37΄ |
Long:
21ο 23΄ |
Alt:
46 m |
Lat:
40ο 31΄ |
Long:
22ο 58΄ |
Alt:
4 m |
|
MONTH |
TEMPERATURE |
TEMPERATURE |
TEMPERATURE |
TEMPERATURE |
|
MEAN |
MEAN MAX |
MEAN MIN |
MEAN |
MEAN MAX |
MEAN MIN |
MEAN |
MEAN MAX |
MEAN MIN |
MEAN |
MEAN MAX |
MEAN MIN |
|
JAN. |
13.0 |
16.3 |
8.8 |
10.5 |
15.2 |
5.3 |
8.6 |
13.3 |
3.8 |
4.9 |
9.0 |
1.2 |
|
FEB. |
13.3 |
16.6 |
8.6 |
11.0 |
16.1 |
5.6 |
9.8 |
14.7 |
4.5 |
6.5 |
11.1 |
1.9 |
|
MAR. |
14.7 |
17.9 |
9.6 |
12.6 |
17.7 |
6.5 |
11.9 |
16.8 |
6.2 |
9.5 |
14.1 |
4.2 |
|
APRIL |
17.3 |
20.7 |
11.6 |
15.8 |
20.7 |
9.2 |
15.9 |
21.1 |
9.2 |
14.3 |
19.4 |
7.1 |
|
MAY |
21.0 |
24.7 |
14.9 |
19.9 |
25.1 |
12.4 |
20.4 |
25.9 |
12.9 |
19.8 |
24.8 |
11.7 |
|
JUNE |
25.8 |
29.4 |
19.7 |
24.2 |
29.3 |
15.5 |
25.0 |
30.6 |
16.3 |
24.1 |
29.1 |
15.7 |
|
JULY |
28.3 |
32.2 |
22.8 |
26.9 |
32.4 |
17.4 |
28.1 |
34.1 |
18.4 |
26.6 |
31.6 |
18.2 |
|
AUG. |
28.1 |
32.1 |
23.0 |
27.1 |
33.0 |
17.8 |
28.2 |
34.5 |
18.7 |
26.2 |
31.6 |
17.9 |
|
SEP. |
25.1 |
28.8 |
19.9 |
24.0 |
30.0 |
16.0 |
23.9 |
30.3 |
16.0 |
21.8 |
27.2 |
14.7 |
|
OCT. |
21.7 |
25.4 |
16.6 |
19.6 |
25.7 |
12.8 |
18.6 |
24.5 |
12.5 |
16.0 |
21.5 |
10.2 |
|
NOV. |
18.3 |
21.9 |
14.1 |
15.4 |
21.0 |
9.9 |
13.9 |
19.3 |
8.9 |
11.4 |
16.3 |
6.7 |
|
DEC. |
14.8 |
18.0 |
10.8 |
11.9 |
16.9 |
6.7 |
10.2 |
14.8 |
5.9 |
6.9 |
11.3 |
2.8 |
|
Y E A R |
20.1 |
23.7 |
15.0 |
18.2 |
23.6 |
11.2 |
17.9 |
23.3 |
11.1 |
15.7 |
20.6 |
9.4 |
TABLE 4. GEOGRAPHICAL DISTRIBUTION OF GREENHOUSES IN GREECE DURING 1988 AND 2002.
|
PLACE |
Area (ha) |
|
1998 |
(%) |
2002 |
(%) |
|
1. |
East Macedonia & Thrace |
95 |
2.5 |
72 |
1.6 |
|
2. |
West and Central Macedonia |
682 |
18.0 |
720 |
16.4 |
|
3. |
Epiros |
168 |
4.4 |
214 |
4.9 |
|
4. |
Thessalia |
120 |
3.2 |
126 |
2.9 |
|
5. |
Peloponnese & West Sterea Hellas |
871 |
23.0 |
971 |
22.2 |
|
6. |
Attica & Islands |
281 |
7.4 |
345 |
7.9 |
|
7. |
Creta |
1570 |
41.5 |
1935 |
44.1 |
|
TOTAL |
3787 |
100 |
4383 |
100 |
TABLE 5. TOTAL AREA AND PRODUCTION OF VEGETABLES DURING 2002
|
Crop |
Area (ha) |
Production (tons) |
|
Potatoes |
38,416 |
916,780 |
|
Tomatoes Processing |
15,221 |
877,440 |
|
Tomato fresh |
10,994 |
395,690 |
|
Cabbage |
7,085 |
165,470 |
|
Onions |
6,950 |
181,340 |
|
Watermelons |
6,830 |
248,520 |
|
Beans |
6,005 |
57,340 |
|
Asparagus |
5,320 |
37,140 |
|
Melon |
4,296 |
75,490 |
|
Summer squashes |
3,755 |
80,200 |
|
Lettuce |
3,501 |
131,560 |
|
Spinach |
3,496 |
45,690 |
|
Pepper |
3,356 |
67,260 |
|
Cauliflower |
3,192 |
62,330 |
|
Eggplants |
2,614 |
63,270 |
|
Artichokes |
2,466 |
25,950 |
|
Endives |
2,324 |
35.990 |
|
Leeks |
2,195 |
38,840 |
|
Okra |
1,461 |
11,810 |
|
Garlic |
1,185 |
9,950 |
|
Peas |
1,178 |
10,210 |
|
Carrots |
968 |
34,300 |
|
Fresh broadbeans |
803 |
7,460 |
|
Cucumbers fresh |
786 |
16,840 |
|
Red beets |
741 |
15,760 |
|
Celery |
603 |
11,810 |
|
Pepper |
335 |
8,050 |
|
Radish |
244 |
2,890 |
|
Parsley |
204 |
3,290 |
|
Strawberries |
113 |
1,910 |
|
White beet |
51 |
1,170 |
|
Cucumbers processing |
25 |
520 |
|
Total |
136,763 |
3.643,370 |
TABLE 6. AREA OF VEGETABLES GROWN IN GREENHOUSES AND LOW TUNNELS IN GREECE DURING 2002
| |
CROP |
Greenhouse |
Low tunnels |
|
Area (ha) |
Production (tons) |
Area (ha) |
Production (tons) |
|
1. |
Tomatoes |
2.700 |
266.197 |
144 |
6.992 |
|
2. |
Cucumbers |
1.240 |
122.285 |
4 |
90 |
|
3. |
Sweet Peppers |
594 |
20.982 |
25 |
1.020 |
|
4. |
Eggplants |
128 |
9.798 |
24 |
895 |
|
5. |
Melons |
192 |
10.450 |
237 |
5.765 |
|
6. |
Summer Squashes |
128 |
6.388 |
1.505 |
50.950 |
|
7. |
Watermelons |
126 |
4.346 |
6.791 |
305.407 |
|
8. |
Green beans |
260 |
5.762 |
13 |
243 |
|
9. |
Lettuce |
222 |
7.089 |
3 |
65 |
|
10. |
Strawberries |
171 |
4.300 |
140 |
3.481 |
|
11. |
Other |
87 |
1.503 |
0 |
1.690 |
|
Total |
5.848 |
459.098 |
8.885 |
376.598 |
* The total cultivated greenhouse area with vegetables looks bigger compared to the area under greenhouse structures. This is due to the fact that certain greenhouses are cultivated twice a year.
FIG. 1. TOTAL AREA (HA) OF VARIOUS VEGETABLE CROPS UNDER PRODUCTION IN HIGH GREENHOUSES DURING 2001-2002 GROWING SEASON
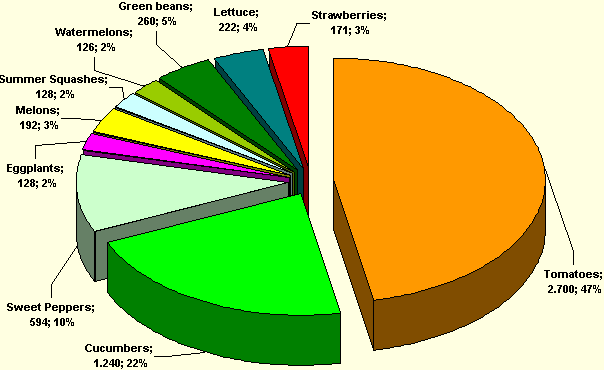
FIG. 2. TOTAL PRODUCTION (TONS) OF VARIOUS VEGETABLE CROPS UNDER PRODUCTION IN HIGH GREENHOUSES DURING 2001-2002 GROWING SEASON
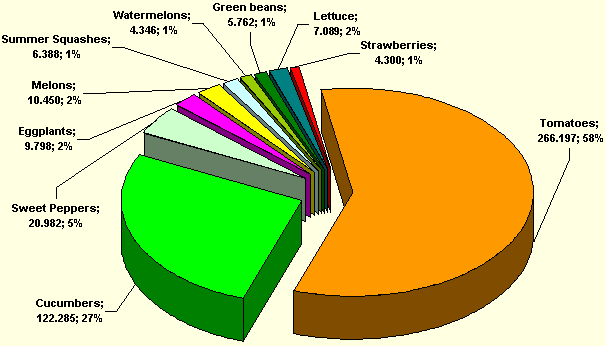
TABLE 7. MAIN VEGETABLE HYBRIDS GROWN IN GREENHOUSES AND LOW TUNNELS IN GREECE (2004)
|
Cucumber hybrids |
Watermelon hybrids |
Watermelon rootstocks |
Tomato hybrids |
|
722 Virginia RZ |
Obla |
TZ-148 F1 |
Bellandonna |
|
Z 14 |
Crisby |
Takii |
Formula |
|
Azor |
Dumara |
Silver |
Electra |
|
Gador |
Florida |
Macis |
Jumbo |
|
Imanol |
Farao |
Combi |
Marvel |
|
Almon |
Crismson Tide |
Early Star |
Marcella |
|
Super bambina |
|
|
|
|
Saldo |
|
|
|
| |
|
|
|
|
Sweet pepper hybrids |
Eggplant hybrids |
Summer squash hybrids |
Sweet melon hybrids |
|
Spartacus |
Ecavi |
Abotanza |
Galia |
|
Roldan |
Volta |
Armada |
Dicti |
|
Sammy |
Kava |
Ipanema |
Supra |
|
Tragon |
Rima |
|
Caladon |
|
Topatsio |
|
|
Melina |
|
Ballo |
|
|
|
|
Cappy |
|
|
|
TABLE 8. TYPES OF GREENHOUSES USED AT PRESENT (ONLY VEGETABLES)
|
TYPE |
AREA (ha) |
|
1998 |
2002 |
|
Glasshouses |
44 |
38 |
Standardized metallic with plastic cover : Arch type =
Double span = |
388 |
665 |
|
315 |
684 |
|
Standardized mixed (metal +wood) with plastic cover : |
488 |
538 |
|
Standardized wooden with plastic cover : |
340 |
363 |
|
Old type : (a) arch type |
914 |
644 |
|
(b) double span (metallic roof) |
454 |
327 |
|
(c) double span (wooden roof) |
496 |
975 |
|
(d) double span (mixed roof, wooden +metal) |
338 |
86 |
|
Others |
100 |
657 |
|
Total |
3787 |
4383 |
Increase between 1998 and 2002 : 15,7 %
Average increase 149 ha/year
FIG.3. PERCENT OF GREENHOUSES WITH AND WITHOUT HEATING.
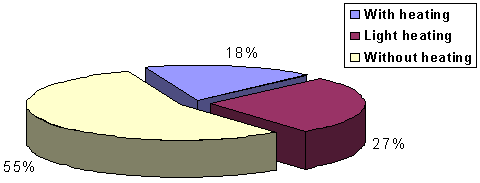
FIG. 4. SOURCES OF ENERGY FOR GREENHOUSES HEATING
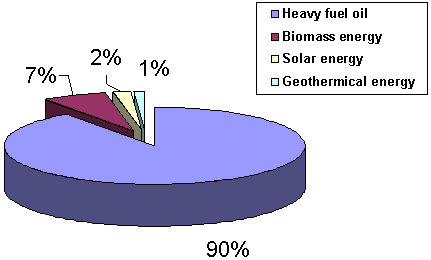
FIG. 5. TYPES OF HEATING SYSTEMS
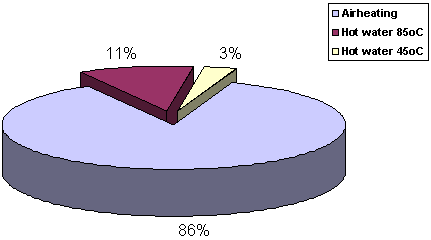
TABLE 9. EXPORTS OF VEGETABLE CROPS IN EU AND OTHER COUNTRIES GROWN IN GREENHOUSES AND LOW TUNNELS DURING THE PERIOD 1998-2002
|
Crop |
1998 |
1999 |
2000 |
2001 |
2002 |
|
Quantities (tons) |
% E.U. |
Quantities (tons) |
% E.U. |
Quantities(tons)
OTHER COUNTRIES |
% E.U. |
Quantities (tons) |
% E.U. |
Quantities(tons) |
% E.U. |
|
Cucumbers |
16.316 |
89 |
17.396 |
86 |
15.510 |
95 |
25.347 |
90 |
25.030 |
86 |
|
Watermelons |
168.064 |
66 |
206.878 |
67 |
176.674 |
68 |
167.957 |
68 |
208.048 |
66 |
|
Summer squashes |
241 |
87 |
417 |
35 |
|
|
|
|
941 |
77 |
|
Eggplants |
424 |
10 |
682 |
3 |
|
|
|
|
340 |
9 |
|
Lettuce |
20 |
0 |
36 |
0 |
|
|
|
|
85 |
0 |
|
Tomatoes |
4.443 |
3 |
4.257 |
3 |
2.340 |
5 |
2.856 |
3 |
6.259 |
1 |
|
Sweet peppers |
2.918 |
20 |
2.550 |
19 |
2.298 |
45 |
5.762 |
74 |
9.856 |
72 |
|
Sweet Melons |
610 |
32 |
894 |
1 |
913 |
0 |
990 |
5 |
1562 |
1 |
|
Fresh Beans |
|
|
8 |
50 |
|
|
|
|
167 |
0 |
|

