|
 Country report Turkey Country report Turkey
PROTECTED CULTIVATION IN TURKEY
Y. Tüzel
Ege Univ. Faculty of Agriculture
Dept. of Horticulture
35100 Bornova, Izmir/TURKEY
tuzel@ziraat.ege.edu.tr
Abstract
Protected cultivation has an important role in horticultural activities. There was a 6-fold increase in protected cultivation area and a 3.5 to 10-fold increase in greenhouse and tunnel area during the last twenty-five years. According to the recent statistics, the total area of protected cultivation has reached 53 603 ha in 2002. Area under greenhouse is 57 % of the total while the rest is occupied by low plastic tunnels.
This paper is aimed to summarize the recent situation of protected cultivation in Turkey.
Introduction
The actual surface area of Turkey including lakes and rivers is 81.5 million ha (78 million land). The country is characterized by a great diversity of agroecological zones. Geographically Turkey is situated in temperate region, but the diverse nature of the landscape, and the existence in particular of the mountains that run parallel to the coasts, results in significant differences in climatic conditions from one region to the other. While the coastal areas have milder climates, the inland Anatolian plateau has hot summers and cold winters with limited rainfall.
In Turkey, forests occupy 20,703,000 ha of land and about 26.4 million ha of land is suitable for crop production. Cultivated area (26,379,000 ha) is devoted to field crops (18,207,000 ha), fallow (4,826,000 ha), orchards (1,418,000 ha), vegetable growing (793,000 ha), olive groves (600,000 ha) and vineyards (535,000 ha) (Fig. 1) (http://www.die.gov.tr/istTablolar.htm#tar).
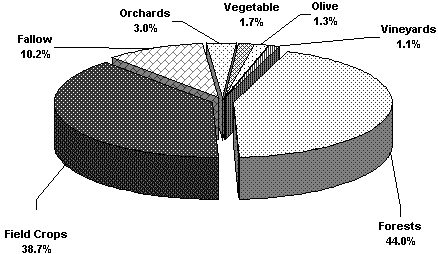
Fig. 1. Proportions of cultivated and forest area.
In the last three decades, the contribution of agriculture to the GNP (Gross National Product) decreased from 35 % in 1970 to 13.5 % in 2000. Despite this decrease, agriculture still plays an important role in the national economy. About 14 % of the national income comes from agriculture of which almost two third is from crops. Crop production represents 55 % of the agricultural sector followed by livestock (34 %) whereas forestry and aquaculture occupies the rest (11 %). About 35 % of population lives in rural areas and 45 % of economically active population is employed in agriculture. In 2000, export of agricultural products (crop and livestock) was 2.6 billion USD (Bozkurt and Engiz, 2001).
Protected Cultivation
Protected cultivation includes the production in the greenhouses and under low plastic tunnels. Total protected cultivation has reached to 53 603 ha in 2002. Area under low plastic tunnel is 43 % (23049 ha) of the total while the rest (30 554 ha) is occupied by greenhouses (DIE, 2003) (Fig. 2).
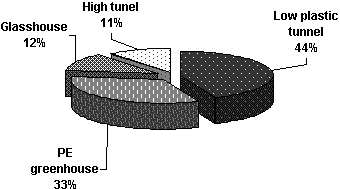
Fig. 2. Distribution of low plastic tunnels, high tunnels, and glass and PE greenhouses (%).
There was a 6-fold increase in protected cultivation area and a 3.5 to 10-fold increase in greenhouse and tunnel area during the last twenty-five years. The protected cultivation area increased 53.7 % between 1993 and 2002 (Fig. 3).
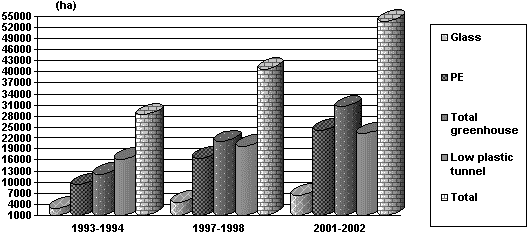
Fig. 3. Development in protected cultivation between 1993-2002.
In 2001-2002, 75 % of the greenhouses and 70.3 % of protected cultivated area are located in the Mediterranean Region (Fig. 4 & 5). Those figures show that greenhouses and low plastic tunnels are mainly located on the south and west coasts of the country where the climatic conditions are favourable for protected cultivation without any additional heating.
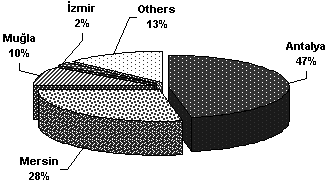
Fig. 4. Distribution of greenhouses according to locations.
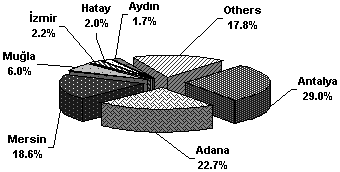
Fig. 5. Distribution of protected cultivation area according to locations.
The increase in greenhouse area is due to the high demand in domestic market, attractive crop prices, dominancy of family enterprises (of an average size of 1.000 - 3.000 m2), sharecropper system and 25 % subsidy between the years of 1990-1995 (Titiz, 2004).
Cultivated Crops
Vegetable growing with 96 % of the total greenhouse area stands first, ornamental plants (3 %) especially cut flowers occupy the second place and these are followed by fruits.
Vegetables: Among the vegetables, tomato with 47 % of total vegetable production under cover is the most prominent while cucumber, watermelon (in particularly under low plastic tunnels), pepper, eggplant, squash, melons and other vegetables are grown over rest of the area (Table 1). Lettuce growing has an increasing tendency, as well.
Floriculture: In recent years, cut flower production has gradually increased. Table 2 shows the production of cut flowers, ornamentals and bulbs in different regions. Cut flower contribution within the production and value is the highest.
Fruits: Banana plantations are under protection at a very limited area on the Mediterranean coast (66.597 tons). Strawberry takes the second place under cover (56.946 tons).
Table 1. The vegetable production figures under cover (DIE, 2003).
|
2000 |
2001 |
2002 |
2003 |
|
1.375.103 |
1.417.667 |
1.632.175 |
1.940.324 |
|
1.043.706 |
977.623 |
903.360 |
984.357 |
|
335.504 |
270.699 |
312.144 |
315.108 |
|
183.523 |
214.642 |
254.153 |
262.614 |
|
80.720 |
130.085 |
103.115 |
112.445 |
|
485.381 |
510.691 |
823.293 |
669.751 |
|
91.753 |
86.485 |
66.514 |
59.392 |
|
40.435 |
24.370 |
20.932 |
22.042 |
|
37.451 |
27.821 |
41.191 |
41049 |
|
3.478 |
3.232 |
3.542 |
4.074 |
Table 2. The cultivation area of cut flowers, ornamentals and bulbs (ha) (Özzambak, 2003).
|
Marmara |
Aegean |
Mediter-ranean |
Others |
Total |
% |
Product.
amount
(x106 number) |
Value
(x106$) |
% |
|
350.2 |
336.5 |
319.7 |
17.4 |
1002.38 |
61.4 |
406 |
41 |
56 |
|
315 |
144.7 |
32.9 |
71.64 |
564.25 |
33.8 |
25-30 |
15 |
20 |
|
20.4 |
16.1 |
14.9 |
2.65 |
54.12 |
3.2 |
12-15 |
15 |
20 |
|
8.3 |
6.23 |
6.71 |
5.81 |
26.74 |
1.6 |
24-25 |
2.5 |
4 |
|
693.9 |
503.53 |
374.21 |
97.5 |
166.90 |
100 |
467 |
73.5 |
100 |
Present status of protected cultivation
Covering materials: A total of 79 % of the greenhouses are covered with plastic films (PE) and the remaining with glass (Fig. 6).
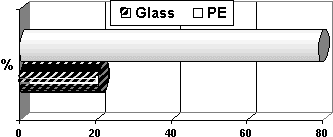
Fig. 6. Distribution of covering materials used in greenhouses.
Plastic film for covering is generally polyethylene. It lasts for one year, whereas, there are UV, UV+IR, UV+IR+AF (antifog) and UV+IR+AF+AV (antivirus) resistant PE at the market which are lasting for more.
Ventilation:
Insufficient ventilation is still one of the most important problems particularly in the small-size plastic houses. Recent years, roof ventilation ratio has increased.
Heating:
There is no regular heating in the greenhouses. Roof sprinkler irrigation and simple firewood stoves and in recent years pulsed air boiler (with LPG, wood, fuel, etc) are used only to protect the plants against frost under conditions when temperature falls below 3-5oC.
In terms of renewable energies, geothermal is the most promising one but it is still not used effectively.
Technology of production
Seed supply: Seed production is carried out both by public and private sectors. The public sector produces seed of wheat, barley, rice and cotton whereas the private sector produces almost seed of all hybrids (maize, sunflower, vegetable), soybean, potato, vegetable and some forage crops. Some private companies import parental lines or basic seed and produce certified seed locally.
Most of the cultivars are F1 hybrids in protected cultivation. A large proportion of hybrid seeds are imported. Table 3 shows the quantity and value of seeds exported and imported (data from the Ministry of Agriculture & Rural Affairs).
Table 3. Quantity (tonnes) and value (USD) of seed import and export in Turkey (TKB, TÜGEM 2004).
Crop |
Import |
Export |
|
Quantity (t) |
Value ($) |
Quantity (t) |
Value ($) |
|
2002 |
2003 |
2002 |
2003 |
2002 |
2003 |
2002 |
2003 |
|
Cereal crops |
913 |
4 090 |
2 488 |
6 872 |
4 714 |
12 855 |
10 856 |
13 257 |
|
Industrial Crops |
14 496 |
7 868 |
9 261 |
8 797 |
3 270 |
3 107 |
6 057 |
7 826 |
|
Forage Crops |
403 |
581 |
426 |
817 |
1 |
--- |
------ |
----- |
|
Turf grass |
2 131 |
2 809 |
3 047 |
4 045 |
27 |
31 |
90 |
108 |
|
Vegetables(hybrid) |
411 |
222 |
36 255 |
44 193 |
10 |
3 |
113 |
80 |
|
Vegetables (stand.) |
737 |
542 |
3 815 |
6 525 |
90 |
99 |
204 |
180 |
|
Veg. Total |
1 148 |
764 |
40 070 |
50 718 |
100 |
102 |
317 |
260 |
|
TOTAL. |
19 091 |
16 212 |
55 292 |
71 249 |
8 112 |
16 095 |
17 320 |
21 451 |
Seedling production: Generally farmers grow their own seedlings. Since high temperature and insect infection cause problems in autumn and low temperature and light effect spring season seedling production, farmers started to work with the seedling companies. Private seedling companies increased during the last few years. Already, there are 30 private companies producing seedlings. Their annual production area is over 40 ha. The annual production number is 800 million (Table 4).
Table 4. The change of seedling production between the years of 1999-2003 (Abak, 2003).
|
Year |
Number of company |
Area (Ha) |
Annual capacity (as number) x106) |
|
1999 |
12 |
20 |
500 |
|
2003 |
30 |
40 |
800 |
Soil preparation: Production is still generally made in soil, but there is an increasing interest in the use of soilless culture techniques to overcome the problems originated from soil, and till now the soilless cultivation area has reached 75 ha at farmers' level. But it is evident that it will be increase, if the upcoming phase out of methyl bromide under the Montreal Protocol is taken into account. Table 5 shows the private companies using soilless culture technique for vegetable production.
Irrigation: Generally drip irrigation is used in the greenhouses. By the use of drip irrigation, water loss is decreased to the minimum.
Fruit-setting methods: The use of bumble bees is gradually increased. There are two companies (Biobest and Coppert)) selling hives to the growers.
Table 5. Companies using using soilless culture technique in Turkey.
|
Company |
Area (ha) |
Crops |
Place |
|
Agrobay |
12 |
Tomato, pepper |
İzmir |
|
Özaltın |
10 |
Tomato, pepper |
Antalya |
|
Agroser |
6 |
Tomato, pepper |
Antalya |
|
Balabanlar |
6 |
Tomato, pepper |
Antalya |
|
Türkeli |
6 |
Tomato, pepper |
İzmir |
|
Antalya Tarım |
4.2 |
Vegetable, cut flower |
Antalya |
|
Akbulut |
4 |
Cut flower |
Mersin |
|
Halis Seracılık |
3.2 |
Tomato |
Adana |
|
Ayer |
3 |
Cut flower |
Antalya |
|
Yavuzlar |
3 |
Tomato |
Antalya |
|
Meristem |
2.6 |
Cut flower |
Aydın |
|
Sapeksa |
2.5 |
Tomato |
Adana |
|
Ekinciler |
2.5 |
Tomato |
Mersin |
|
Hasan Serin |
2 |
Tomato, pepper |
Mersin |
|
Naturel |
2 |
Cut flower |
Mersin |
|
Eylül tarım |
1.4 |
Tomato |
Mersin |
|
Göncüoğlu Tarım |
1.5 |
Tomato |
Manisa |
|
Yenteks |
1 |
Tomato |
Adana |
|
Tuğtekin Çiçekçilik Ltd. |
0.8 |
Cut flower |
Yalova |
|
Mustafa Çınar |
0.6 |
Cucumber, tomato, lettuce |
İzmir |
|
Ali Çevik |
0.5 |
Tomato |
Adana |
|
Hasan Hüseyin Erbudak |
0.2 |
Cucumber |
İzmir |
|
Şener Piyar |
0.1 |
Cucumber, lettuce |
İzmir |
|
Mehmet Aslan |
0.1 |
Tomato, hıyar |
İzmir |
|
TOPLAM |
75.2 |
|
|
Plant Protection: The pesticide consumption increased 48.4 % between the years of 1979 and 2000 (Table 6). Although the annual increase is 2.3 %, 2/3 of the pesticide consumption is realized at the Mediterranean and Aegean Regions where the protected cultivation is intensive (Delen, 2002).
Table 6. Pesticide consumption (kg or liters).
|
Years |
|
Pesticides |
1979 |
1978 |
1994 |
1996 |
2000 |
2002 |
|
Insecticides |
2287658 |
3303446 |
2064991 |
3027380 |
2694080 |
2250898 |
|
Acaricides |
203107 |
240360 |
192279 |
223857 |
266641 |
296809 |
|
Oils |
1594526 |
2147106 |
1970281 |
2871160 |
2606924 |
2428238 |
|
Fumigants and Nematocides |
315665 |
322227 |
530738 |
1076661 |
994445 |
1559489 |
|
Rodenticides and Mollucides |
5600 |
2124 |
2509 |
3268 |
6390 |
1794 |
|
Fungucides |
1537315 |
2611960 |
2201406 |
2951191 |
2692957 |
1964292 |
|
Herbicides |
2451977 |
3495044 |
3902588 |
3643971 |
3197078 |
3697396 |
|
TOPLAM |
8 395 848 |
12 122 267 |
10 864792 |
13 797 488 |
12 458 515 |
12 198 916 |
Fresh Vegetable Exportation
The amount of fresh vegetable exportation is 554.000 tons (Table 7). The main importer countries are Russian Federation (23 %), Germany (19 %), Saudi Arabia (13 %) , Greece and Romania (7 %) (Table 8) (http://www.igeme.org.tr).
Table 7. Fresh vegetable exportation (Amount: 1000 Ton - Value: 1000 US$).
|
Crops |
2000 |
2001 |
2002 |
|
|
Amount |
Value |
Amount |
Value |
Amount |
Value |
|
Watermelon |
11 |
1.332 |
11 |
1.614 |
11 |
1.821 |
|
Melon |
6 |
1.503 |
10 |
2.129 |
11 |
2.368 |
|
Tomato |
120 |
37.482 |
191 |
48.914 |
253 |
69.953 |
|
Potatoes |
128 |
23.078 |
105 |
12.831 |
32 |
2.295 |
|
Dry onion |
82 |
11.132 |
160 |
16.231 |
141 |
13.790 |
|
Pickling cucumber |
8 |
3.503 |
20 |
7,074 |
24 |
8.340 |
|
Carrot |
17 |
2.970 |
30 |
3,902 |
29 |
3.088 |
|
Pepper |
32 |
20.313 |
40 |
19.651 |
51 |
25.000 |
|
Fresh vegetables |
420 |
112.000 |
577 |
122.000 |
554 |
139.000 |
|
TOTAL |
1.064 |
369.000 |
1.420 |
459.000 |
1.544 |
515.000 |
Table 8. Fresh vegetable importing countries (Amount: Ton - Value: US $)
|
Countries |
2000 |
2002 |
|
|
Amount |
Value |
Amount |
Value |
|
Russia Fed. |
43.459 |
12.427.682 |
124.246 |
32.347.814 |
|
Germany |
34.292 |
21.749.890 |
38.801 |
25.722.560 |
|
Saudi Arabia |
115.200 |
16.230.607 |
155.712 |
18.378.945 |
|
Greece |
6.249 |
2.362.196 |
33.381 |
9.721.017 |
|
Romania |
17.973 |
5.756.735 |
43.832 |
9.313.200 |
|
Holland |
4.797 |
3.293.175 |
8.758 |
6.312.622 |
|
Yugoslavia Fed. |
6.014 |
1.834.068 |
26.327 |
5.681.353 |
|
Austria |
9.812 |
5.534.309 |
7.474 |
5.063.003 |
|
France |
4.312 |
3.279.270 |
6.371 |
4.605.731 |
|
Switzerland |
2.874 |
1.638.631 |
3.454 |
2.386.493 |
|
Macedonia |
4.365 |
1.468.689 |
5.820 |
1.946.881 |
|
Bosna-Herzagovina |
1.835 |
728.280 |
5.141 |
1.319.852 |
|
United Kingdom |
1.089 |
796.760 |
1.444 |
1.110.544 |
|
Slovenia |
1.171 |
499.338 |
2.840 |
1.016.659 |
|
Bulgaria |
1.492 |
283.580 |
76.630 |
991.842 |
|
TOTAL |
420.000 |
112.000.000 |
554.000 |
139.000.000 |
Conclusion
Turkey possesses some advantages in terms of climatic conditions, geothermal sources, cheap labor and thus increasing the chance of exportation. Introduction of sustainable technologies in greenhouses will help to support these advantages. The present status of protected cultivation in Turkey seems to be in a quite acceptable level; however, there is still need to update.
References
Abak, 2003. Sera ve serada üretim teknolojilerindeki gelişmeler. Workshop on "Protected Cultivation". 24 October, Izmir.
Bozkurt, B., M. Engiz, 2001. Focus on Seed Programs The Seed Industry in Turkey. Delen, N., 2002. Türkiye'de tarim ilaci kullanimi ve sorunlari. TAYEK/TYUAP Tarimsal Araştirma Yayin ve Egitim Koordinasyonu, Tarla Bitkileri Grubu 2002 Yili Bilgi Alişveriş Toplantisi Bildirileri. Eds. A.Ş.Tan, A. Aydin, N. Ercan, M.A. Gül, A. Oguz. Ege Tarimsal Araştirma Müdürlügü Yayin No 109:233-247.
http://www.die.gov.tr/istTablolar.htm#tar
http://www.igeme.org.tr/
http://www.icarda.cgiar.org/seed_unit/Pdf/Focus/FOCUS-Turkey.pdf
Özzambak, E., 2003. Süs bitkileri içinde kesme çiçegin yeri ve önemi. 2. Cut Flower Symposium, 23 October. Izmir.
Titiz, S., 2004. Modern Seracilik: Yatirimciya Yol Haritasi (Modern Greenhouse Technology: Roadmap for the investors). Ansiad, Antalya, 124 s.
|